In our earlier post, we discussed the profit-maximizing conditions of a single-product firm. But in the real world, the business firm produces more than one product. In this post, we will discuss the profit-maximizing conditions of a multi-product firm. Also, note that the equilibrium of a firm equals the profit maximization of that firm and vice versa.
Before we delve into the core topic, let us first review the very important tools from the economic profession—the Edgeworth Box diagram, production possibility curve, and iso-revenue line. These tools are the fundamentals for understanding the equilibrium of multi-product firms. Then, we will elaborate on the necessary and sufficient conditions for this equilibrium.
Assumption of theory
The exposition of theory rests upon the following assumptions:
- Objective of a firm is profit maximization.
- Firm is multi-product firm and produces at least two product X & Y.
- Each production function uses capital and labor to produce one single good i.e. production functions to individual good take the form of X =f (K,L) and Y =f(K,L).
- Prices of factors inputs and prices of products remain constant at least during the analysis.
- Technology of production remains same throughout the analysis.
Based on the above assumptions, we can say that the firm produces only two goods – X and Y – using both of the factor inputs capital, K, and labor, L. Also note that there are two production techniques – X =f (K, L) and Y =f(K, L) to produce goods X and Y, respectively. The corresponding sets of isoquants can represent each production technique. We can assume a set of isoquants X’s to represent the technique to produce X suitable and a set of isoquants Y’s to represent the technique to produce Y good. Against this backdrop, the Edgeworth Box diagram is presented in the following section.
What does Edgeworth Box diagram show?
It is very important tool in economics and shows how economic efficiency one can obtain with the best usages of limited productive resources. Not every combination of resources – capital and labor- is efficient within the Edgeworth Box, but some points that form contract curve are efficient. Edgeworth Box diagram depicts how to mobilize resources from inefficient usages to efficient usages.
Also observe the following facts in Edgeworth Box:
$latex \Rightarrow$ Set of isoquants X’s originating to Ox denotes production function X=f(K,L) and set of isoquants Y’s originating to Oy denotes production function Y=f(K,L).
$latex \Rightarrow$ The higher the isoquants X’s, the larger the output of X it shows. Similarly, the further down the isoquants Y’s, the larger the output of Y it shows.
$latex \Rightarrow$ Total amount of capital K – shown in vertical axis, and total amount of labor L – shown in horizontal axis, are the total available resources.
Explanation of Edgeworth Box diagram
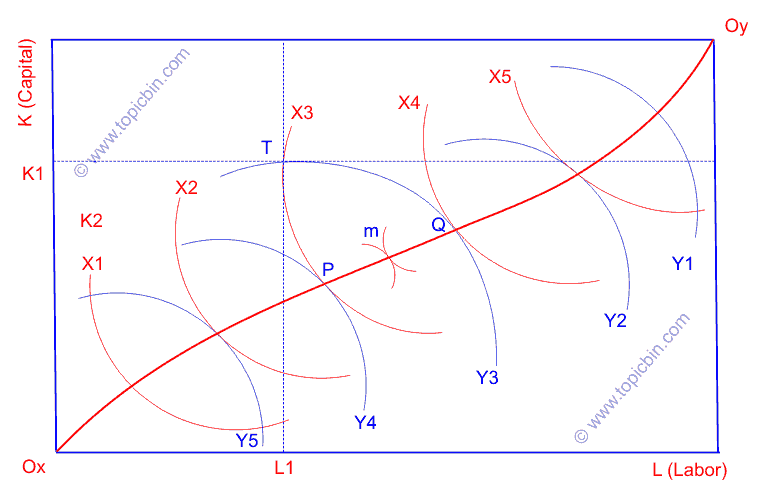
We can perceive isoquants X’s and Y’s, facing each other, tangent at points within the Edgeworth Box. We can expect a large number of isoquants X’s and Y’s even though we have shown only a few of them, and thus, many such tangency points. If we connect such points of tangency, we get a contract curve (curve OxOy in the picture). This curve is the locus of points representing all the economically efficient methods of producing X and Y goods. Any point of this curve implies the inefficient use of limited resources.
For instance, suppose firm produces at point T (in above figure), where it uses OxK1 of total capital K and OxL1 of total labor L to produce X3 output. Similarly, it uses remaining resources – K1K of total capital K and L1L of total labor L – to produce Y3 output.
However, moving towards points P and Q on the contract curve while using the same amount of resources, the firm can produce more of at least one good without reducing the output of other goods. At point P, a firm can produce Y4 without reducing X3. Similarly, a firm can produce X4 at point Q without losing Y3. If the firm moves to points between P and Q, say point m, it can produce more of both goods using the same resources. Thus, only points on the contract curve represent the efficient production method; any points off this curve indicate the inefficient production method.
What is production possibility curve?
It is a very important tool in economics that enables producers or firms to efficiently choose from alternative products. We can derive the production possibility curve (PPC) directly from Edgeworth Box’s contract curve by projecting it (contract curve) into the X and Y planes of goods.
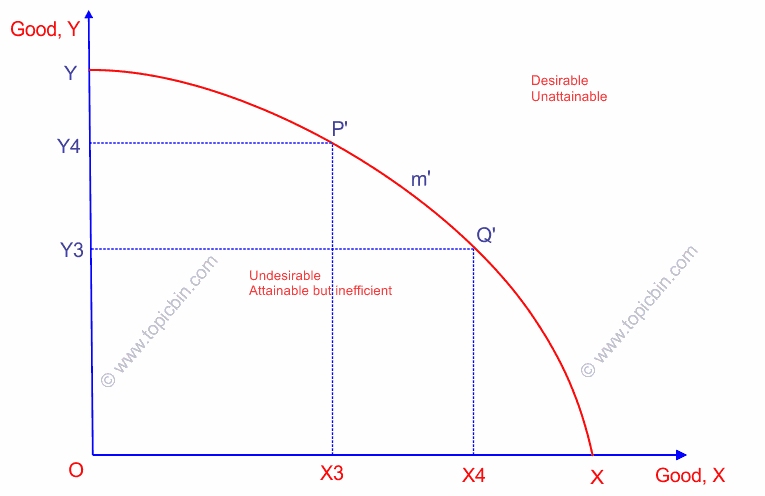
Points P, m, and Q on the contract curve are the respective points P’, m’, and Q’ on the PPC curve. Also, I’d like you to please note the corresponding amount of goods X’s and Y’s in the PPC curve. Any points above the PPC curve YP’m’Q’X are desirable but unattainable given the state of technology and factor inputs. Likewise, any points below the PPC curve are attainable but undesirable because they represent the inefficient usage of resources.
The PPC curve is also called a product transformation curve because moving from one point to another on the PPC implies transforming one product into another. However, the transformation of products takes place via the diversion of resources from one product to another.
What is marginal rate of product transformation?
It is the rate at which one product is transferred to another, holding constant the resources. In other words, it is the amount of Y good forgone for the additional one unit of X good, denoted by MRPTx,y. The more we transfer Y to X, the lesser the X we get from transformation; thus, MRPTx,y increases. The concave shape of the PPC curve results from the increasing marginal rate of product transformation. Also, I’d like to point out that the marginal rate of product transformation (also a slope of PPC at that point) at any point on the PPC curve is given by the slope of the tangent at that point.
What is iso-revenue line?
It is a locus of combinations of products that give the same revenue. In other words, it represents the various combinations of X and Y goods whose sales provide the same revenue to the firm. That means to say, any points on the iso-revenue curve give a constant level of revenue to the firm. The higher the iso-revenue lines from the origin, the greater the revenue it depicts.
Let us present iso-revenue line mathematically,
R = Px . X + Py . Y
where Px is price of good X, Py is price of good Y, and R is revenue. Also note that the slope of iso-revenue line is given by the ratio of Px to Py i.e. Px / Py.
How a multi-product firm reaches equilibrium?
After having introduced the PPC and iso-revenue line, it is time to explore how a multi-product firm reaches equilibrium (maximizes revenue for the given prices of products). The firm has to maximize revenue constrained by the given prices of factor inputs and products, given PPC, and given limited factor inputs. So, this analysis is a constrained profit maximization.
There are two conditions for the profit maximization:
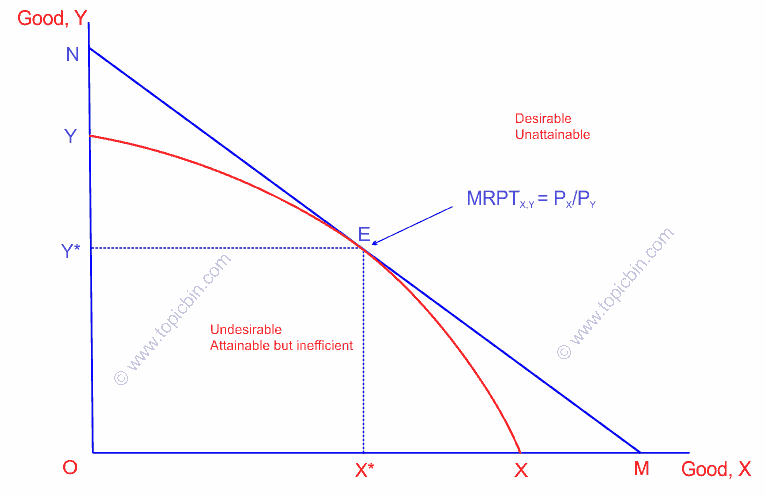
- Slope of PPC must equal to slope of iso-revenue line i.e. MTPTX,Y = PX /PY .
- PPC must be concave to origin.
In the following figure, the firm reaches equilibrium at point E, fulfilling both conditions and produces X* amount of X good and Y* amount of Y good. Given the prices of products X and Y goods, and thus given PX /PY, iso-revenue line MN is the highest possible line to represent the highest amount of revenue. Any lines above the MN line are desirable but unattainable. Similarly, any lines below the MN line are attainable but undesirable and inefficient because they do not maximize profit. Thus, only the MN line maximizes profit, fulfilling the required conditions.
What happens if PPC becomes convex to the origin? The answer is that it ends with the corner solutions producing one of either goods and resulting in a more significant revenue than otherwise. In such a situation, we have to rule out the assumption of a multi-product firm. This is in contradiction to our basic premise, so we consider only concave PPC.